
⚠ This EA is no longer part of our current lineup
We no longer offer or recommend it to new users. The figures and descriptions on this page are kept as a record from the time of publication and have not been re-checked against our current verification standards. If you already use it, please consider switching to one of the successor/alternative EAs below.
⚠ Experimental EA · not in ranking · ruin by design
This EA is a martingale + averaging-down "ruin-by-design" EA. The improvements turned the backtest profitable, but a 100% win rate / zero losses is a result that is "merely a rare, huge loss happening not to have occurred during the test period" — a danger sign specific to averaging-down. We do not make it a flagship or recommend it. If you operate it, strictly observe: surplus funds only, daily withdrawal, and 5% or less of your portfolio. For a robust BTC strategy, we recommend BITCOIN COMET (trend version).
⚠ EXPERIMENTAL NANPIN
BITCOIN KAMIKAZE Averaging-Down
Improved version (3 PDCA cycles)
8-yr live MT5 BT (2018-2025 / M1 every tick)
Cumulative
+60%
8 yr
Margin DD
25%
Trades
40
5/yr
Win Rate
100%
⚠ Danger sign
⚡ Minimum deposit: from 100k JPY (for averaging-down types, a Micro (cent) account is strongly recommended)
You can operate from 100k JPY. Because BTC averaging-down involves high volatility plus floating losses, Micro (cent) account is strongly recommended (the real risk of a 0.01 lot is about 1/100, far safer). This EA's input CentAccount=true automatically adapts the cent account's USD-denominated thresholds (stop-loss $1,500, etc.). ⚠ Experimental, ruin by design, surplus funds only, daily withdrawal recommended.
⚠ BITCOIN KAMIKAZE Averaging-Down
A BTCUSD-only averaging-down EA. Improvements added a regime filter (stops the BUY cycle during downtrends) + averaging-down freeze + a hard margin stop-loss, and with BUY-only and reward-risk inversion (take-profit $1,500 / stop-loss $1,500), it turned from a blowup type into profitable. Even so, the inherent risk of sudden moves remains, so it is treated as an experimental EA.
Pair
BTCUSD
Timeframe
M5
Recommended Broker
Exness
Live BT Period
8 yr
PDCA HISTORY
📊 Improvement History (3 PDCA cycles, live MT5)
| Cycle | Measure | Best Result |
|---|---|---|
| Default | None (RSI counter-trend averaging-down) | -33% / PF0.62 / Margin DD77% |
| 1 | Flat lot, equity stop, levels/distance (6 configs) | All PF0.41-0.64 |
| 2 | Regime filter implemented (downtrend freeze) (4 configs) | All PF0.54-0.63 |
| 3 | BUY-only + regime + flat lot + reward-risk inversion (TP $1,500 / SL $1,500) | +60% / DD25% / Win Rate100% |
Input tweaks alone could not make it profitable; it only improved after implementing a new regime filter in the source code. Same direction as GOLD KAMIKAZE (which has a built-in downtrend freeze).
⚠ Why It Is "Experimental, Non-Flagship" (an honest assessment)
- a 100% win rate / zero lossesis too clean = a huge loss from a rare crash simply did not occur during the test period (the classic "right before blowing up" look of averaging-down)
- The margin DD exceeded the configured stop-loss ($1,500), reaching 25% = the downside is not fully contained
- At 5 trades/yr it is low-frequency = a small statistical sample / no Monte Carlo run
- Falls under this project's lesson "don't make a blowup type a flagship live" → not listed in the ranking, not recommended
Verification Status
How far verification has progressed, from backtest to forward testing
- BacktestDone
- Period
- 2018-2025
- Years verified
- 8
- Trades
- 40
- Max DD
- 25.3%
- Cumulative return
- +60%
- OOSCaution
- Survival rate
- 60.0%
Survival rate from Monte Carlo trials. Out-of-sample validation on third-party tick data has not been done.
- ForwardNot started
This EA has no published forward-test record yet. Until results appear here, judge it only by the backtest / OOS figures above.
- LiveNot started
Run Mode
The "RunMode" dropdown switches how aggressively the EA trades. Only the lot (risk) changes — entry/exit logic, symbol and timeframe stay the same.
Defensive
×0.5Half the Standard lot. For capital preservation or first-time automated trading.
Standard (recommended)
×1.0The reference risk level. Start here.
Aggressive
×2.0Twice the Standard lot. Drawdowns deepen and the risk of ruin rises. Use only money you can afford to lose.
Per-mode backtests for this EA have not been measured. We do not publish figures estimated from Standard.
Past performance does not guarantee future results. With compounding on, lots adjust automatically to the balance.
📈MT5 Strategy Tester Report — BITCOIN KAMIKAZE Averaging-Down
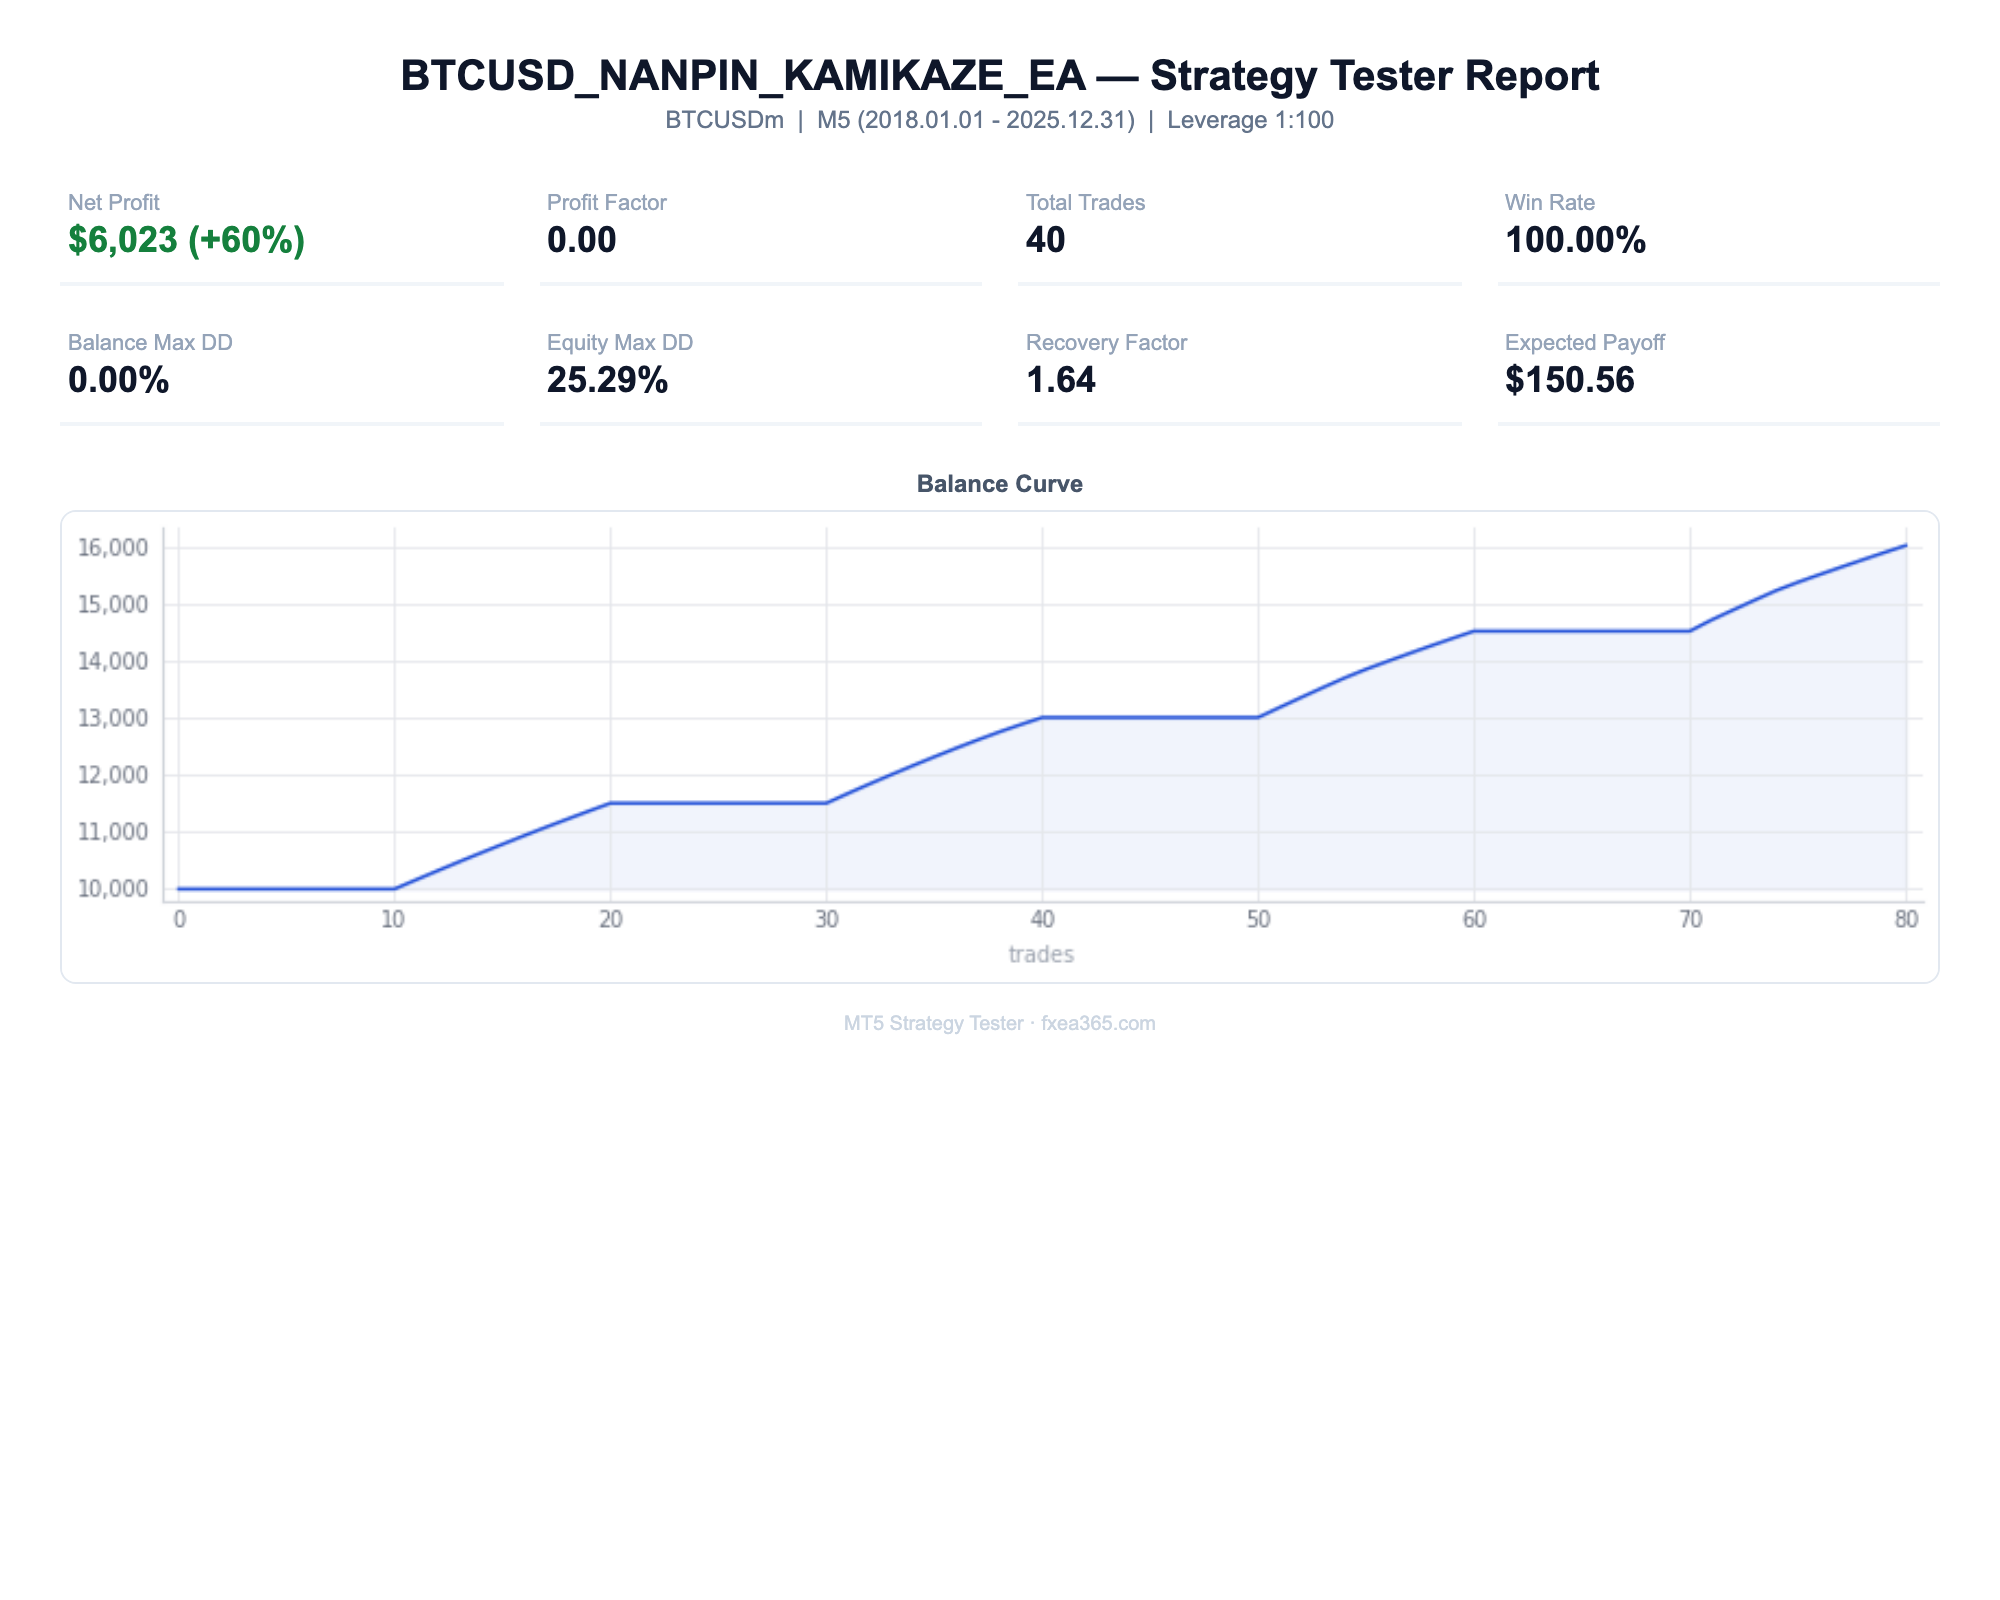
📋 About this report
- Official report generated by the MT5 Strategy Tester (real-tick data)
- Multi-year real price data with the every-tick (real ticks) model
- Balance curve (blue) / Equity curve (green) shows floating losses too
- Past results do not guarantee future profits