
MT5 Backtest Report Guide: Profit Factor, Sharpe, Drawdown
Contents
How to Read an MT5 Backtest Report [2026 Guide]
When you run a backtest in the MT5 Strategy Tester, the results tab fills up with a wall of numbers. If you've ever wondered "which numbers actually matter?" or "is this result good or bad?", this guide has you covered. We'll walk through every metric, explain what it measures, and give you concrete pass/fail benchmarks.
The Big Picture
After running a backtest in the MT5 Strategy Tester, the Results tab displays the following figures:
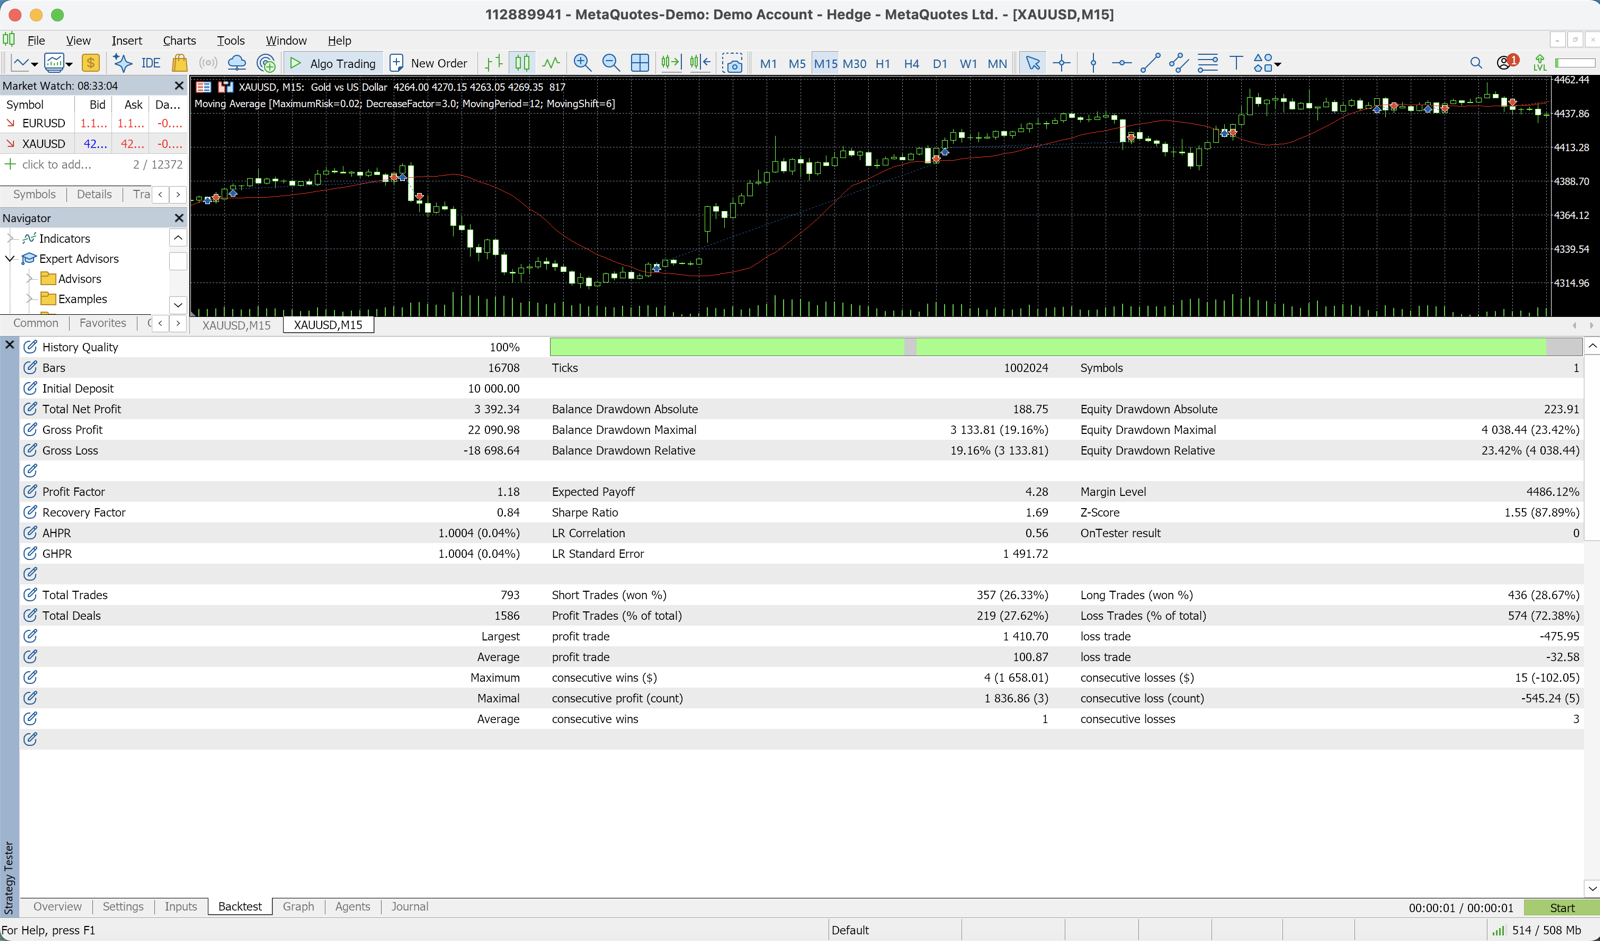
Net Profit
Profit Factor
Expected Payoff
Balance Drawdown Max
Balance Drawdown Max %
Total Trades
Win Rate
Sharpe Ratio
What Each Metric Means — and What to Look For
Profit Factor (PF)
Formula: Total Gross Profit ÷ Total Gross Loss
| PF Value | Rating |
|---|---|
| 2.0 or above | Excellent (but check for over-optimization) |
| 1.5 – 2.0 | Very good |
| 1.3 – 1.5 | Good (where most reputable EAs land) |
| 1.1 – 1.3 | Caution — a small slip tips it into the red |
| 1.0 or below | Fail — negative expected value |
Important: A PF above 2.5 is a strong warning sign of curve fitting (over-optimization).
Maximum Drawdown (Max DD)
What it measures: The largest peak-to-trough decline in account balance during the backtest period, expressed as a percentage.
| Max DD | Risk Rating |
|---|---|
| Under 5% | Low risk (ultra-stable) |
| 5 – 10% | Low to moderate (beginner-friendly) |
| 10 – 20% | Moderate (generally acceptable) |
| 20 – 30% | High (manage position sizing carefully) |
| Over 30% | Very high (proceed with caution) |
Note: EAs with large historical drawdowns tend to produce even larger drawdowns in the future. Treat the backtest figure as a floor, not a ceiling.
Win Rate
Formula: Winning trades ÷ Total trades × 100
Win rate alone tells you almost nothing. You must evaluate it alongside the risk-reward ratio (RR ratio).
| Win Rate | Minimum RR Ratio | Verdict |
|---|---|---|
| 70% or above | 1:0.5 or better | Excellent (scalping-style) |
| 50 – 70% | 1:1 or better | Good |
| 40 – 50% | 1:1.5 or better | Acceptable (trend-following style) |
| 30 – 40% | 1:2 or better | Watch carefully (only viable with high RR) |
| Under 30% | 1:3 or better | High risk — requires active monitoring |
Key principle to remember: A 40% win rate with a PF above 1.5 is a strong EA. Don't dismiss low win rates automatically.
Total Trades
| Trade Count | Statistical Reliability |
|---|---|
| 300 or more | Very high |
| 100 – 300 | High |
| 50 – 100 | Moderate — interpret carefully |
| Under 50 | Low — insufficient data |
If a 5-year backtest produces fewer than 50 trades, the results lack statistical significance and should be treated as indicative at best.
Expected Payoff
Formula: Net Profit ÷ Total Trades
This is the average expected profit per trade (in dollars or your account currency). A positive value means positive expected value; a negative value means the EA loses money on average.
Sharpe Ratio
Return divided by risk (standard deviation). Higher values indicate better risk-adjusted returns.
| Sharpe Ratio | Rating |
|---|---|
| 1.0 or above | Good |
| 0.5 – 1.0 | Average |
| Under 0.5 | Caution |
Reading the Equity Curve (Graph Tab)
In the Graph tab, examine the Balance curve (blue line) and the Equity curve (green line).
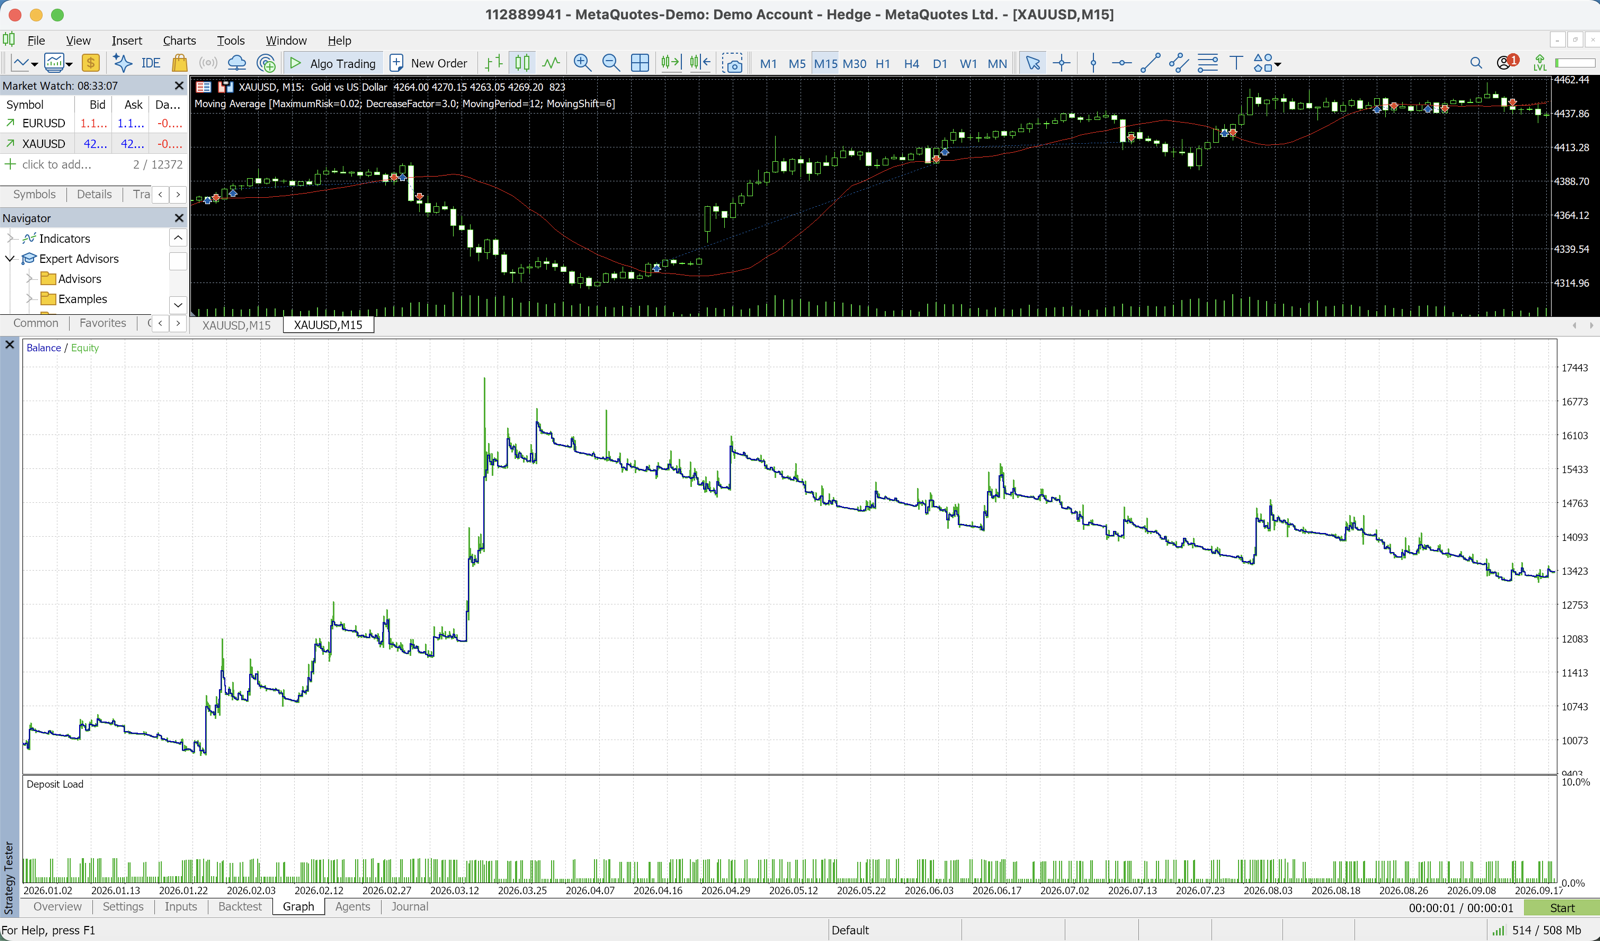
Characteristics of a Good Equity Curve
- A steady, gradual upward slope from left to right
- Drawdowns occur but recover within a reasonable timeframe
- No single period dominates all of the gains (no obvious bias)
Characteristics of a Problematic Equity Curve
- A dramatic spike in only one specific year or period (curve-fitted to that era)
- A drawdown that drags on for years without recovery
- An erratic pattern of sharp spikes followed by sharp drops
The 3 Conditions for a Trustworthy Backtest
- PF ≥ 1.3 — Positive expected value with statistical significance
- Total trades ≥ 100 — Sufficient sample size
- Max DD ≤ 20% — Psychologically and financially manageable
Any EA that fails even one of these conditions should either be put on hold or evaluated with extra scrutiny.
Common Pitfalls
1. Backtest Period Is Too Short
Always verify with at least 5 years of data. Two or three years typically covers only one market regime, leaving the EA blind to the conditions that follow.
2. Over-Fitting (Curve Fitting)
When you over-optimize parameters, you end up with an EA that perfectly matches historical data — and fails on any new data.
Red flags:
- PF above 2.5 (too good to be true)
- Extremely narrow trading filters (e.g., "trade only on Tuesdays between 14:00 and 16:00")
- Large gap between PF in the training period vs. the test period
3. Spread Set Too Low
Running a backtest with unrealistically tight spreads produces results that will never replicate in live trading. This is especially dangerous for scalping EAs.
How to Run a Backtest in MT5
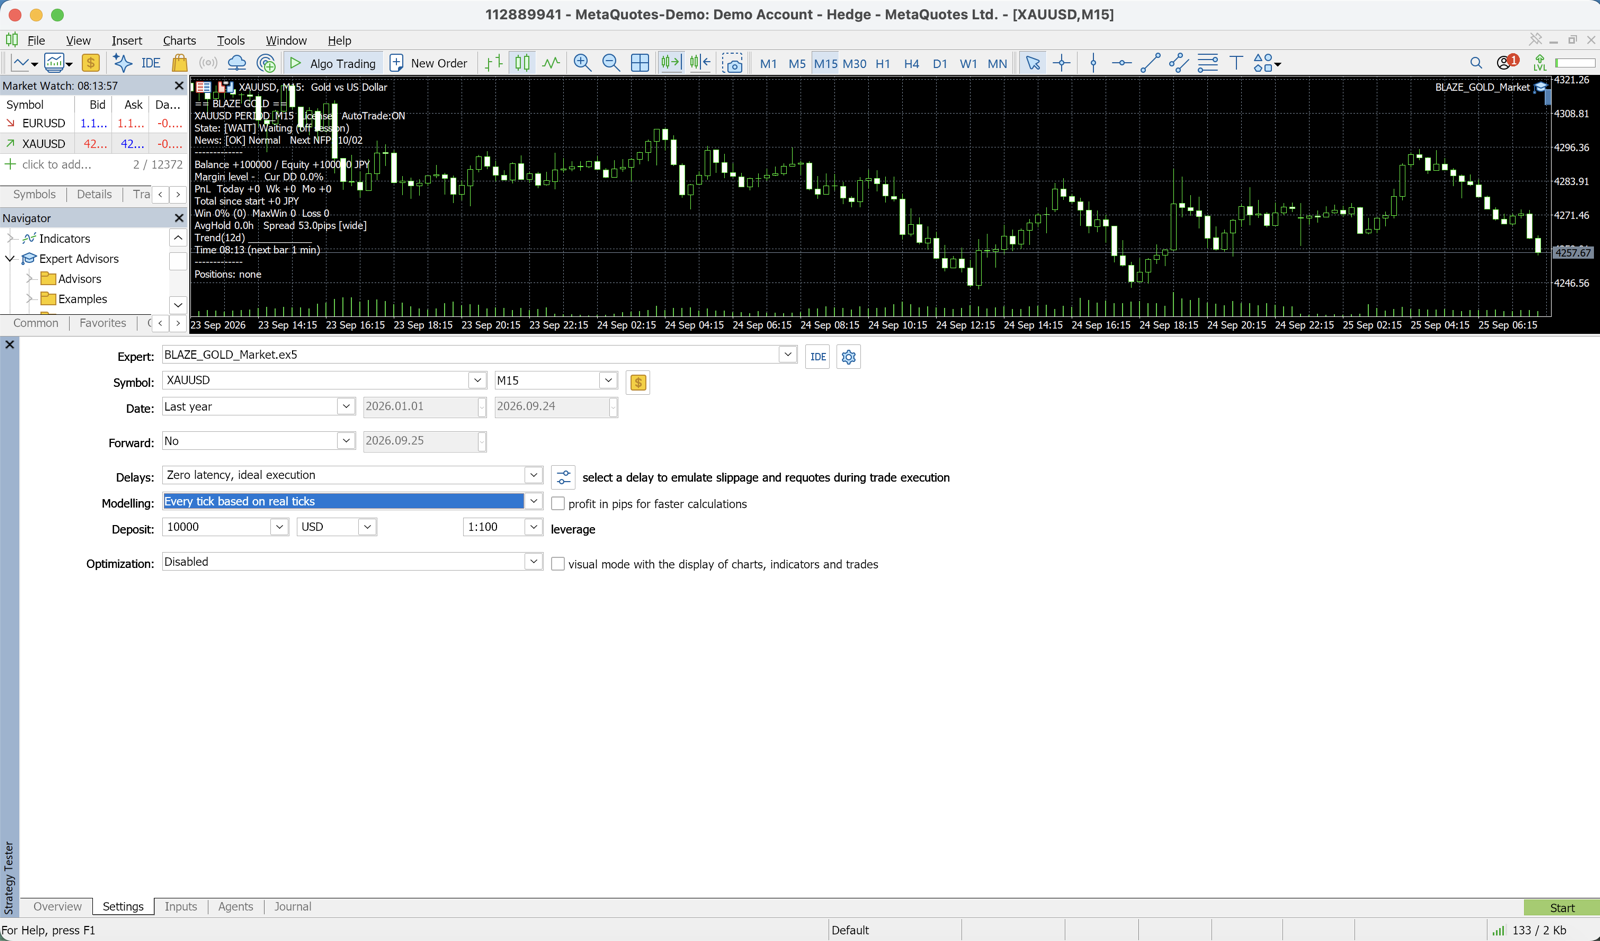
- In MT5, go to View → Strategy Tester (or press Ctrl+R)
- Select your EA
- Set the Symbol: for XM Trading use GOLD; for Exness or HFM use XAUUSD
- Set the Timeframe recommended by the EA
- Under Model, select Every tick (the most precise method based on all available least timeframes)
- Set the Date range to at least 5 years (e.g., 2021.01.01 – 2026.01.01)
- Set Initial Deposit to $10,000 (our standard benchmark)
- Click Start — completion takes a few minutes to about 30 minutes
fxea365's Backtesting Standards
At fxea365.com, we apply the following standards to every EA we publish:
- Period: 5+ years of real-tick price data (XMTrading-MT5 server)
- Model: Every tick (99.9% accuracy)
- Initial deposit: $10,000 (universal baseline)
- Validation: Train (60%) / Test (40%) out-of-sample (OOS) split
- Publication standard: PF ≥ 1.0 AND confirmed OOS robustness
Only EAs that clear all of these criteria are listed on our EA Ranking.
Summary: Your Backtest Checklist, in Priority Order
- Profit Factor (PF) — confirm ≥ 1.3
- Max Drawdown — confirm ≤ 20%
- Total Trades — confirm ≥ 100
- Backtest Period — confirm ≥ 5 years
- Sharpe Ratio — confirm ≥ 0.5
Run through these five checkpoints and you'll be able to cut through the noise and identify genuinely reliable EAs.
FAQ
Q: My EA had PF 2.5 in backtesting, but in live trading it fell below PF 1.0. What happened?
The most common cause is over-optimization (curve-fitting). Parameters that have been fine-tuned to historical data simply do not hold up in the future. Another likely culprit is that the spread used in the backtest was set lower than reality. Try re-running the backtest with a realistic spread — for XAUUSD, that means 30 – 50 pips — and see if the results change.
Q: Can I use an EA with only a 35% win rate if its PF is 1.3 or above?
Yes. When the Risk/Reward ratio (TP ÷ SL) is high enough, a low win rate can still produce a positive expected value. What matters is PF and maximum DD. A PF of 1.3 with DD within 15% is suitable for live trading. If the low win rate bothers you psychologically, test it on a demo account first to see whether you can stick with it during losing streaks.
Q: What is the "Recovery Factor" shown in the report?
Recovery Factor = Net Profit ÷ Maximum Drawdown. A value of 3.0 or above is the general benchmark. The higher it is, the more profit the EA is generating for the same amount of risk. Use it together with PF to assess an EA's overall efficiency.
Related Pages
- Complete Backtest Guide — MT5 Strategy Tester setup and execution, step by step
- Backtest Pitfalls — How to avoid over-optimization and out-of-sample failure
- Backtest Metric Deep Dive — Detailed breakdown of every metric
- FX EA Beginner's Guide — The full picture of running automated trading EAs
- EA Ranking — Compare EAs with verified backtest results
Related
2026-05-10
Getting Started with MT5 Free EAs
2026-10-12
Dark Algo MT5 Review: PF 2.08, Max DD 35.05%
2026-10-12
Daytrade Pro Algo MT5 Review: PF 2.51, Max DD 1.25%
2026-10-12
News Catcher Pro MT5 Review: PF 8.34, Max DD 0.68%
📧 Free 8-email course + subscriber-only pack of 13 MT5 indicators
Right after you sign up, you get a download link for a subscriber-only pack of our 13 MT5 indicators: compiled files (.ex5), source code and a setup guide. Then 8 emails on algo-trading essentials, reading backtests correctly and choosing a broker (one a day for the first 5 days, then 7, 14 and 30 days after signing up). You also get notified before each price rise of the versions sold on the MQL5 Market (launch pricing that steps up as copies sell). Our EAs are free on this site with a live account at a partner broker.
* Privacy strictly protected. You can unsubscribe at any time.
Have a question about EAs or FX?
You can post it on the Nattzy trading forum (free sign-up). Questions beyond this article are welcome too — EA settings, choosing a broker and more.
Ask on Nattzy ↗