
How to Avoid Over-Optimization (Curve Fitting)
Contents
How to Avoid Over-Optimization (Curve Fitting)
"The backtest showed 50% annualized returns — then the moment I went live, it was a straight line down." This is by far the most common failure in algorithmic trading, and the culprit is almost always curve fitting (also called over-optimization or overfitting).
This article covers why curve fitting happens, how to recognize it, and how to design your EA to avoid it from the start.
What Is Curve Fitting?
Curve fitting refers to the phenomenon where an EA's parameters or logic are over-tuned to fit a specific historical price sequence. Historical data always contains random noise — price moves that "just happened that way" by chance. Parameters calibrated to reproduce that noise perfectly cannot adapt to the different randomness that the future will bring.
It's structurally identical to the machine learning problem of "overfitting the training set while collapsing on the test set."
📧 Free 8-email course + subscriber-only pack of 13 MT5 indicators
Right after you sign up, you get a download link for a subscriber-only pack of our 13 MT5 indicators: compiled files (.ex5), source code and a setup guide. Then 8 emails on algo-trading essentials, reading backtests correctly and choosing a broker (one a day for the first 5 days, then 7, 14 and 30 days after signing up). You also get notified before each price rise of the versions sold on the MQL5 Market (launch pricing that steps up as copies sell). Our EAs are free on this site with a live account at a partner broker.
* Privacy strictly protected. You can unsubscribe at any time.
Why Does Curve Fitting Happen?
The main causes are as follows.
Too Many Parameters
If an EA has ten or twenty tunable parameters, you can adjust them to explain virtually any past price movement with near-perfect accuracy. That just traces history — it does not capture the underlying mechanics of the market.
Repeated Optimization Passes
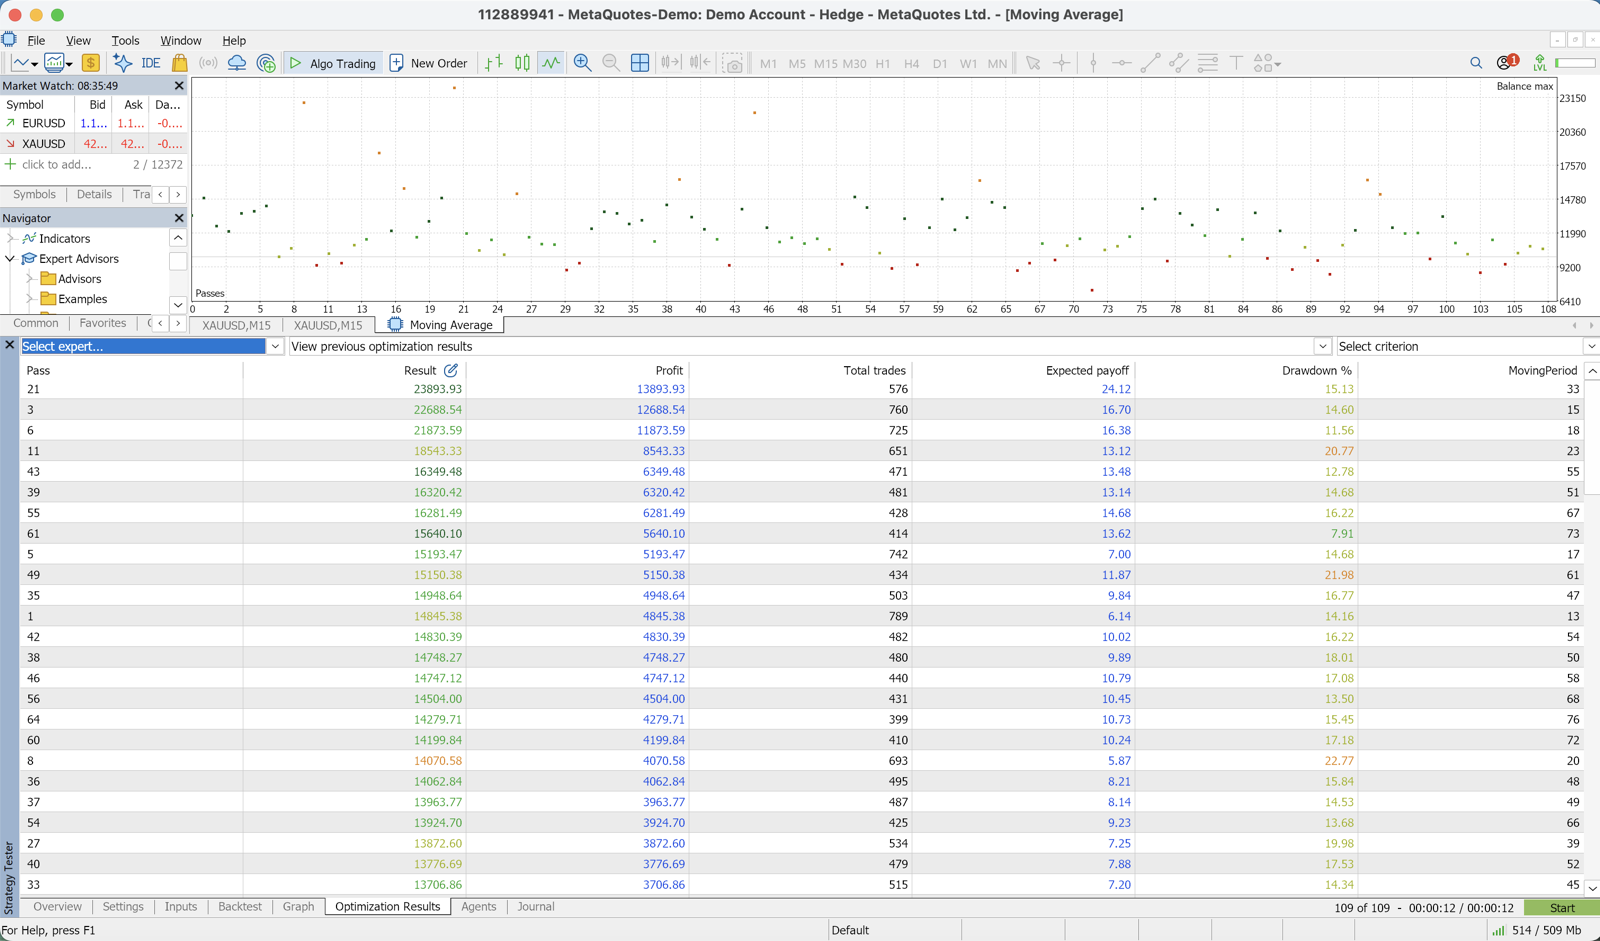
Running optimization over the same dataset repeatedly causes the parameters to gradually conform to the idiosyncrasies of that specific dataset. The more you iterate through "this doesn't work, that doesn't work either," the less likely the result is to perform in future markets.
Choosing the Wrong Performance Metric
If your sole objective is "maximize total profit," you'll tend to select extreme parameters that ignore risk. Solutions that generate profits from a handful of large winning trades are rarely reproducible in the future.
How to Spot It
Here are the warning signs of curve fitting, in order.
1. The Numbers Look Too Good
PF above 3.0, win rate above 80%, annualized return above 100% — whenever you see numbers like these, you should almost always suspect curve fitting. EAs that genuinely sustain these levels over the long term in live trading are exceedingly rare.
2. Too Few Trades
Even a PF of 2.0 based on a few dozen trades carries no statistical significance. Without a minimum of 200 trades — ideally 500 or more — the evaluation itself is unreliable.
3. Wildly Inconsistent Year-by-Year Results
When you look at the annual returns, some years may spike dramatically while others show heavy losses. EAs with extreme year-to-year swings are overly dependent on specific market regimes.
4. Deteriorating Performance in the Most Recent Period
If the most recent one or two years of a ten-year backtest show noticeably worse results, the underlying logic may simply not fit current market conditions.
5. High Parameter Sensitivity
If shifting the optimal parameters by ±10% causes results to collapse significantly, that's a red flag. You're sitting on a sharp peak, and any slight change in conditions will send you off the edge.
How to Avoid It at the Design Stage
Preventing curve fitting from the start is far more efficient than trying to fix it after the fact.
1. Minimize the Number of Parameters
Restrict yourself to parameters that are logically meaningful within the strategy's framework. "I'll make it a parameter since I can adjust it anyway" is exactly what to avoid. Keeping the optimization targets to three to five parameters is realistic.
2. Always Use Out-of-Sample Validation
If you have ten years of data, optimize on the first seven years and validate on the remaining three. Only adopt parameters that produce comparable results in both halves.
3. Test Across Multiple Instruments and Timeframes
An EA that only profits on XAUUSD H1 may simply be overfit to those specific conditions. Logic that shows a consistent edge on EURUSD or USDJPY as well tends to be more robust.
4. Keep the Logic Explainable
Being able to articulate why a given parameter makes a given logic work — in terms of actual market mechanics — is essential. "It just won in the backtest" provides no rationale for why it should work in the future.
5. Optimize Lightly
Avoid running too many generations of genetic optimization; apply filters for trade count and maximum DD in your evaluation metrics; prefer the median of the top results rather than the single best. These "go easy on the optimizer" habits significantly improve resistance to curve fitting.
The Courage to Choose Mediocre Numbers
It's only human to want to pick the best-looking number from optimization results. But most long-term algorithmic traders deliberately choose parameters that produce ordinary, mediocre numbers rather than the peak.
The reasoning is simple: parameters that generate mediocre numbers tend to stay reasonably stable even when the market shifts slightly. Parameters that produce the best numbers are only optimal under those exact conditions.
How We Approach This on This Site
This site's free EA DONCHIAN ENGINE (USDJPY H1) has a backtest over 9.4 years of USDJPY H1 data (2017-2026, Dukascopy real ticks) with PF 1.50, a 34.5% win rate, max DD of 10.8%, and 631 trades.
The numbers aren't flashy, but we value "ordinary numbers" confirmed over a long period and many trades. You can check the latest figures in the Rankings.
Summary
Curve fitting is the single greatest pitfall in algorithmic trading. The more a backtest result looks like a dream, the more vigilant you need to be.
"Mediocre numbers, running for a long time" — this is the understated but proven path to success in EA trading.
Free EA Download
One of the free EAs on this site is DONCHIAN ENGINE (USDJPY H1). Please check its distribution page for details of the verification.
See the free EA DONCHIAN ENGINE
Recommended Brokers
Choosing a broker with high-quality order execution brings your live results closer to what your backtest showed.
Related
📧 Free 8-email course + subscriber-only pack of 13 MT5 indicators
Right after you sign up, you get a download link for a subscriber-only pack of our 13 MT5 indicators: compiled files (.ex5), source code and a setup guide. Then 8 emails on algo-trading essentials, reading backtests correctly and choosing a broker (one a day for the first 5 days, then 7, 14 and 30 days after signing up). You also get notified before each price rise of the versions sold on the MQL5 Market (launch pricing that steps up as copies sell). Our EAs are free on this site with a live account at a partner broker.
* Privacy strictly protected. You can unsubscribe at any time.
Have a question about EAs or FX?
You can post it on the Nattzy trading forum (free sign-up). Questions beyond this article are welcome too — EA settings, choosing a broker and more.
Ask on Nattzy ↗